Drawing the Mandelbrot Set
The Mandelbrot set is generated by iterating the function $f(x)=x^2+c$. Let $x$ (called the seed) be 0 and $c$ (called the constant) be 1.
$$ f(0)=0^2+1=1 $$
Let's use the previous computation as the input for the next.
$$ f(f(0))=f^2(1)=1^2+1=2 $$
And let's do that again and again.
$$\begin{equation*} \begin{gathered} f(f(f(0)))=f^3(2)=2^2+1=5 \\ f(f(f(f(0))))=f^4(5)=5^2+1=26 \\ f(f(f(f(f(0)))))=f^5(26)=26^2+1=677 \\ \dots \end{gathered} \end{equation*}$$
The sequence of values produced by each function application is called the orbit of this certain iteration. Notice that the seed gets bigger and bigger in the orbit above; when it does this we say that the orbit tends to infinity or diverges.
Let's iterate again with the same seed, but with a different constant, 0.
$$\begin{equation*} \begin{gathered} f^1(0)=0^2+0=0 \\ f^2(0)=0^2+0=0 \\ f^3(0)=0^2+0=0 \\ f^4(0)=0^2+0=0 \\ \dots \end{gathered} \end{equation*}$$
Notice how the orbit stays fixed at 0.
Let's iterate with a constant of -1.
$$\begin{equation*} \begin{gathered} f^1(0)=0^2-1=-1 \\ f^2(-1)=(-1)^2-1=0 \\ f^3(0)=0^2-1=-1 \\ f^4(-1)=(-1)^2-1=0 \\ \dots \end{gathered} \end{equation*}$$
Notice how the orbit oscillates between 0 and -1. This is called a cycle with a period of 2. We can also represent its orbit graphically by plotting it.

Let's iterate when the constant is -1.93. Instead of listing the values the orbit produces, I'll just plot them.

And this is iterating with a constant of -1.73.

While these two orbits aren't diverging, there doesn't seem to be a definite pattern to it either. They appear to be completely chaotic.
All in all, either an orbit tends to infinity or it doesn't. If it doesn't, it can stay fixed, cycle, or be unpredictably chaotic. The Mandelbrot set is the graphical representation of whether with seed 0 and a certain constant the orbit tends to infinity—but we can't plot a single number onto a plane, so instead we use complex numbers for the constant. The constant's real part specifies the X coordinate, and the imaginary part the Y coordinate. For example, let's iterate with a constant of $2+2i$.
$$\begin{equation*} \begin{gathered} f^1(0+0i)=(0+0i)^2+(2+2i)=2+2i \\ f^2(2+2i)=(2+2i)^2+(2+2i)=2+10i \\ f^3(2+10i)=(2+10i)^2+(2+2i)=-94+42i \\ \cdots \end{gathered} \end{equation*}$$
Its orbit tends to infinity, so this would be a point in the Mandelbrot set.
In conclusion, the Mandelbrot set is the set of complex numbers $c$ for which the function $f(z)=z^2+c$ does not tend to infinity when iterated with $z=0$. We plot the complex numbers in this set to drawing the Mandelbrot set fractal.
I toyed around with the concept when I made a C program to draw the fractal.
#include <stdio.h>
#include <stdlib.h>
#include <complex.h>
#include <png.h>
#include <stdint.h>
#include <string.h>

#define SCALE 200
#define WIDTH 640
#define HEIGHT 480

/* Uncomment for higher resolutions. */
/*
#define SCALE 1000
#define WIDTH 2880
#define HEIGHT 2160

#define SCALE 8000
#define WIDTH 23360
#define HEIGHT 17280
*/

#define SHIFTX WIDTH/1.35
#define SHIFTY HEIGHT/2

uint8_t color_of_pixel_at(int x, int y) {
    double complex z = 0, c =
        (double)(x-SHIFTX)/SCALE +
        (double)(y-SHIFTY)/SCALE*I;

    /* if we instead loop from 0 to 255 and return i, the
     * resulting image will be much dimmer. */
    for(int i=0; i<127; ++i) {
        if(cabs(z) > SCALE) {
            // `z` diverges. Return how fast it diverged.
            return i*2;
        }
        z = z*z + c;
    }
    // `z` didn't diverge, return white.
    return 255;
}

int main(void) {
    FILE *fp = fopen("out.png", "wb");

    png_structp png = png_create_write_struct(
        PNG_LIBPNG_VER_STRING, NULL, NULL, NULL);
    png_infop info = png_create_info_struct(png);

    png_set_IHDR(
        png, info, WIDTH,HEIGHT, 8,
        PNG_COLOR_TYPE_RGB,
        PNG_INTERLACE_NONE,
        PNG_COMPRESSION_TYPE_DEFAULT,
        PNG_FILTER_TYPE_DEFAULT);

    png_byte **rows = NULL;
    rows = png_malloc(png, HEIGHT*sizeof(png_byte *));

    for(int y=0; y<HEIGHT; ++y) {
        rows[y] = png_malloc(png, sizeof(uint8_t)*WIDTH * 3);
        for(int x=0; x<WIDTH; ++x) {
            memset(&rows[y][x*3], color_of_pixel_at(x,y), 3);
        }
    }

    png_init_io(png, fp);
    png_set_rows(png, info, rows);
    png_write_png(png, info, PNG_TRANSFORM_IDENTITY, NULL);

    /* Can't uncomment because errors appear, don't know why. */
    /*
    for(int y=0; y<HEIGHT; ++y) {
        png_free(png, rows[y]);
    }
    png_free(png, rows);
    png_destroy_write_struct(&png, &info);
    */

    fclose(fp);
}
Compile with gcc main.c -lpng -lm -O3 -ffast-math -o mandelbrot. The program requires the library libpng for writing PNGs. This is my first time using the library, so all of the image writing code is borrowed from places on the internet, and I can't get the code to free the images to work. This is the image the program produces,
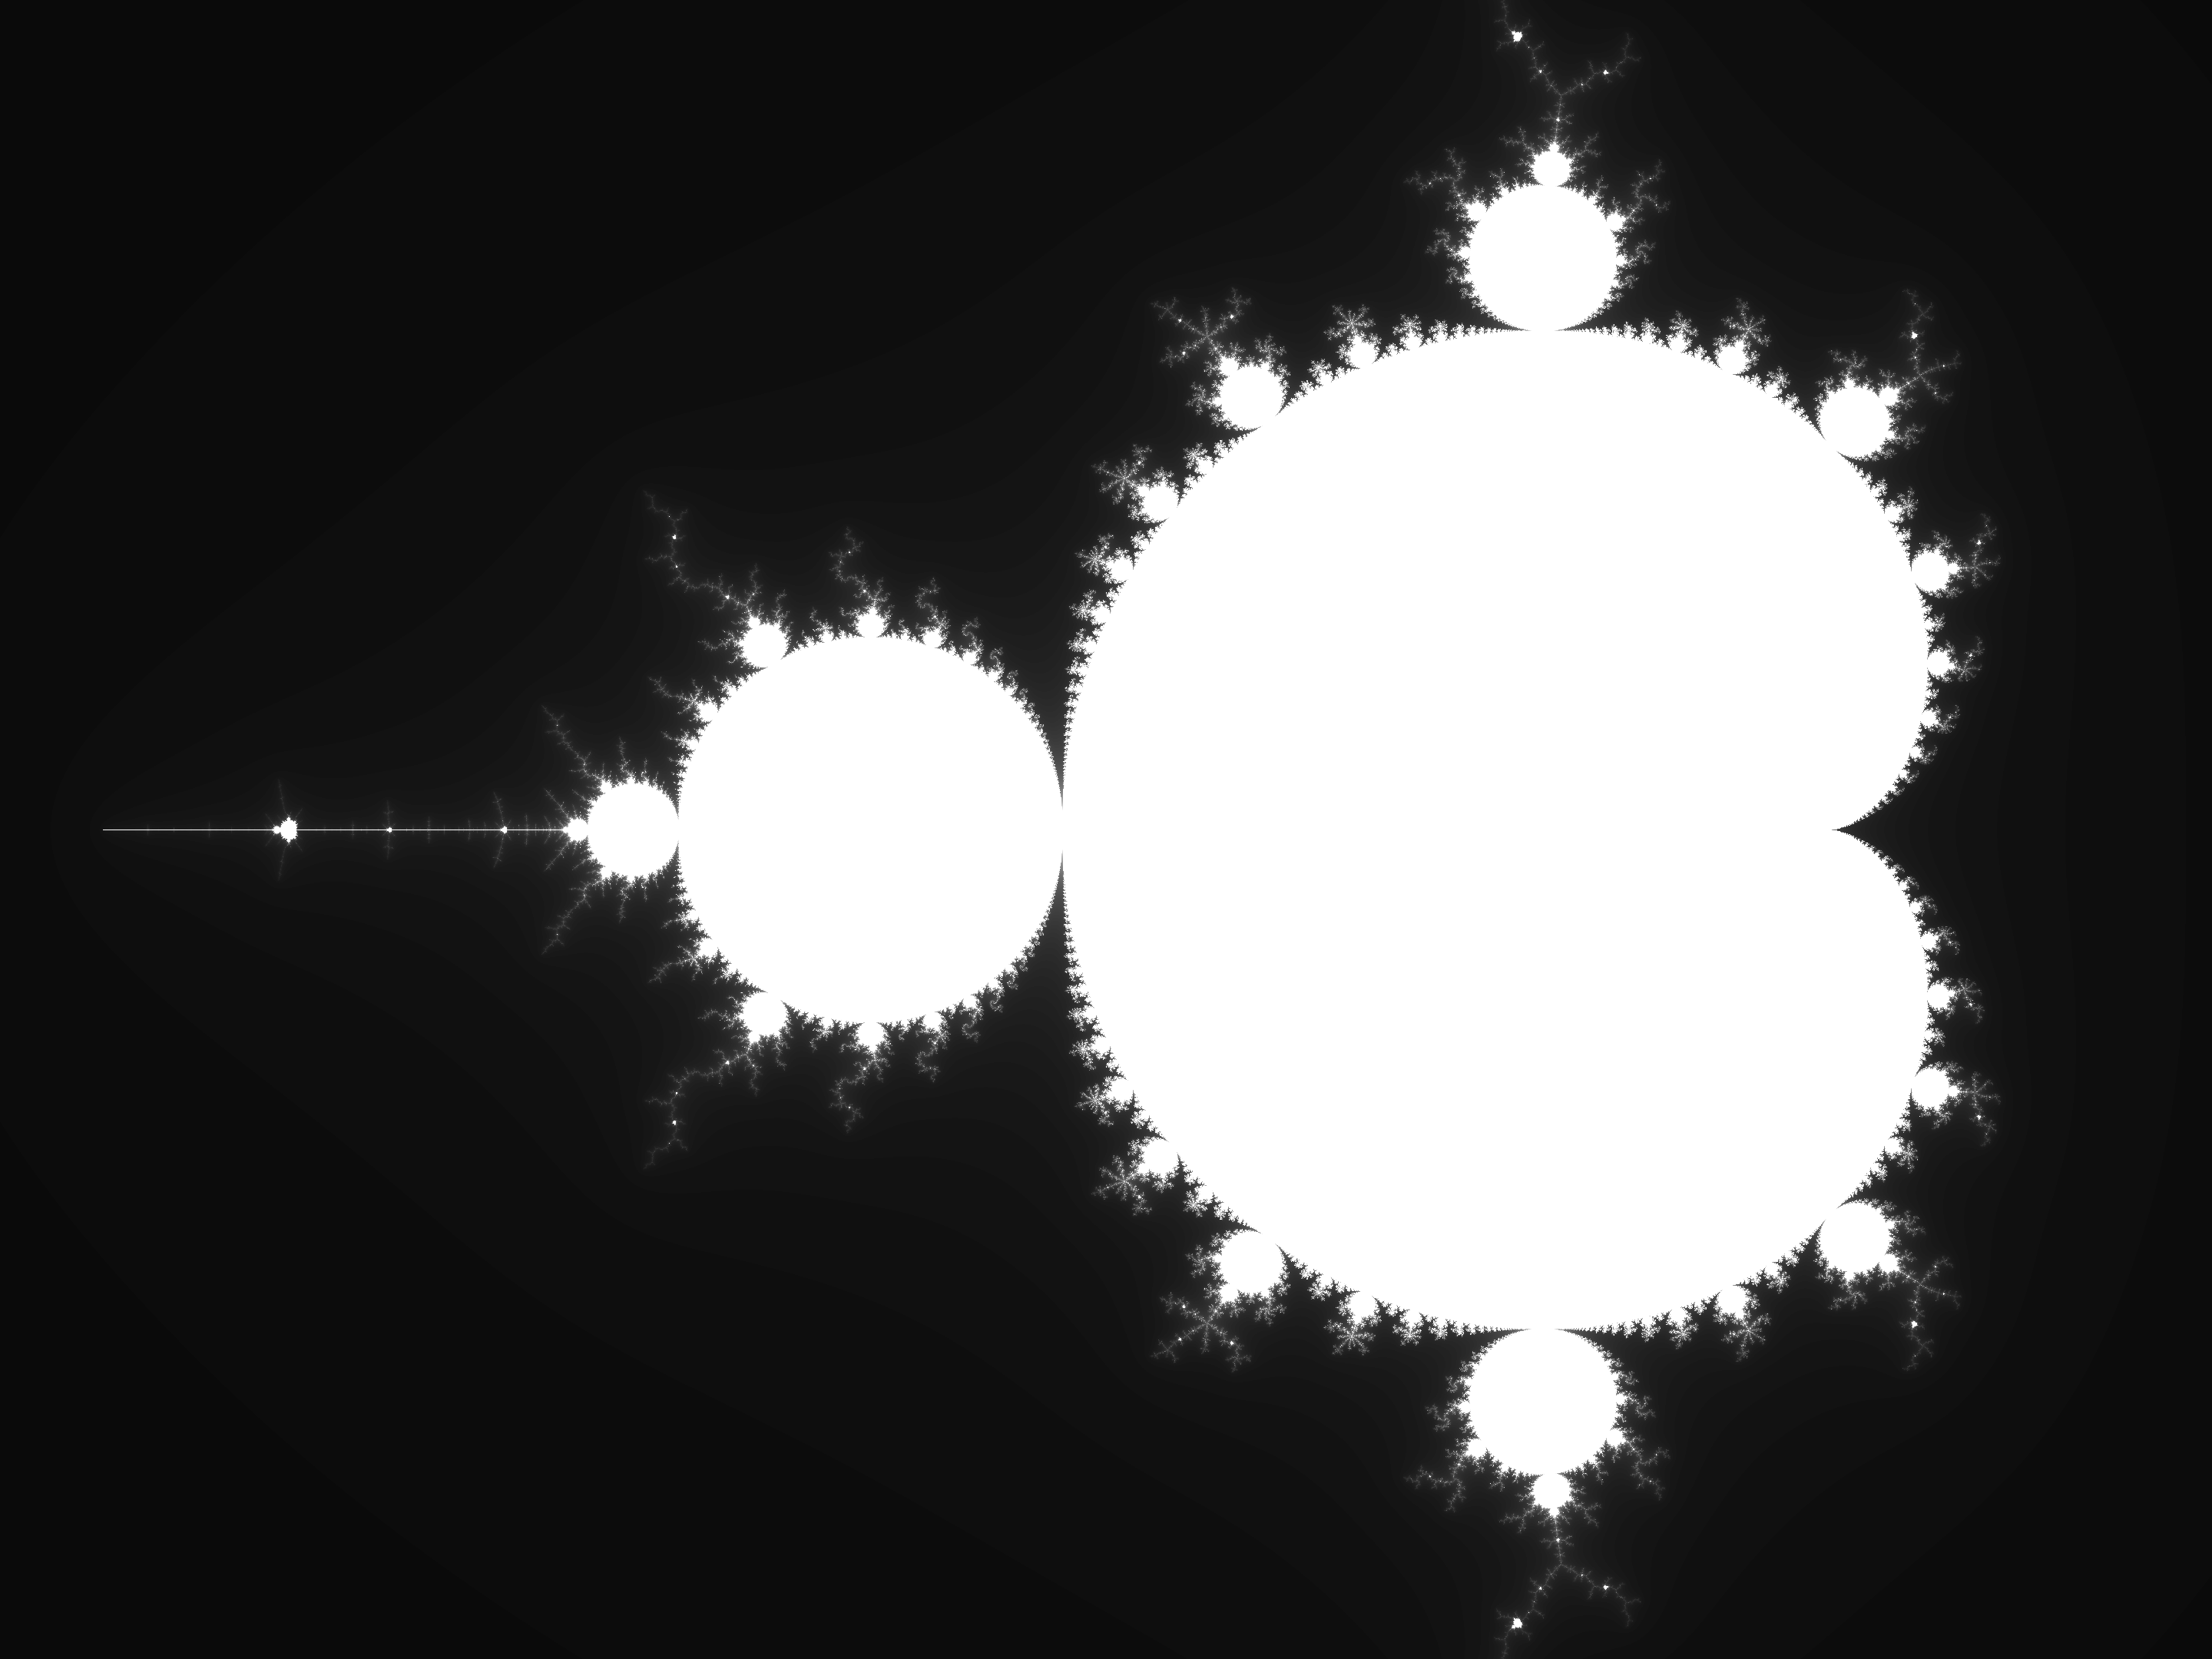
I've ran the program with the following dimensions,
#define SCALE 8000
#define WIDTH 23360
#define HEIGHT 17280
It takes some time (around 3 minutes on my computer), but the end image is beautiful. It takes some time for my image viewer to load the image, but once it does you can really zoom in and see all the detail.